
Page 40 - 《广西植物》2025年第11期
P. 40
1 9 8 4 广 西 植 物 45 卷
3.2 我国外来植物科的区系特征
从植物科的区系成分看ꎬ中国外来植物区系
共有 13 个类型和 34 个变型ꎬ分布区类型较为复
杂ꎮ 热带成分科占据明显优势ꎬ共有 149 科ꎬ占总
科数 的 52. 647%ꎻ 其 中 泛 热 带 分 布 型 ( 62 科ꎬ
21.908%)的占比最高ꎮ 其次ꎬ温带成分的植物科ꎬ
共有 61 科ꎬ占 21. 553%ꎮ 第 三 是 世 界 广 布 类 型
(58 科ꎬ20.495%)ꎮ 这一结果与我国入侵植物的
热带区系成分结果相似(马金双和李惠茹ꎬ2018)ꎬ
中国 70 科入侵植物ꎬ可分为 9 个分布区类型ꎬ热
带成分科共 35 科ꎬ占比最大(50%)ꎬ其中泛热带
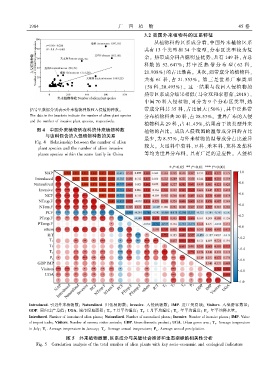
括号里数据分别表示外来植物种数和入侵植物种数ꎮ
The data in the brackets indicate the number of alien plant species 分布植物科共 20 科ꎬ占 28.57%ꎮ 世界广布的入侵
and the number of invasive plant speciesꎬ respectively.
植物科共 29 科ꎬ占 41.43%ꎬ结果高于该类型外来
图 4 中国外来植物所在科的外来植物种数 植物的占比ꎮ 成功入侵我国的温带成分科的占比
与该科包含的入侵植物种数的关系
最少ꎬ为 8.57%ꎬ与外来植物的温带成分占比差异
Fig. 4 Relationship between the number of alien
较大ꎮ 大型科中菊科、豆科、禾本科、苋科及茄科
plant species and the number of alien invasive
plants species within the same family in China 等均为世界分布科ꎬ 具有广泛的适应性ꎮ 入侵植
Introduced. 引进外来植物数ꎻ Naturalized. 归化植物数ꎻ Invasive. 入侵植物数ꎻ IMP. 进口贸易额ꎻ Visitors. 入境游客数量ꎻ
GDP. 国内生产总值ꎻ UGA. 城市绿地面积ꎻ T 7 . 7 月平均温度ꎻ T 1 . 1 月平均温度ꎻ T a . 年平均温度ꎻ P a . 年平均降水量ꎮ
Introduced. Number of introduced alien plantsꎻ Naturalized. Number of naturalized plantsꎻ Invasive. Number of invasive plantsꎻ IMP. Value
of import tradeꎻ Visitors. Number of oversea visitor arrivalsꎻ GDP. Gross domestic productꎻ UGA. Urban green areaꎻ T 7 . Average temperature
in Julyꎻ T 1 . Average temperature in Januaryꎻ T a . Average annual temperatureꎻ P a . Average annual precipitation.
图 5 外来植物数量、区系成分与关键社会经济和生态指标的相关性分析
Fig. 5 Correlation analysis of the total number of alien plants with key socio ̄economic and ecological indicators