
Page 94 - 《广西植物》2026年第1期
P. 94
9 0 广 西 植 物 46 卷
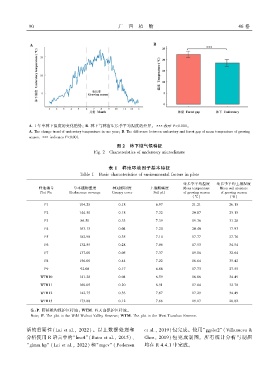
A. 1 年中林下温度的变化趋势ꎻ B. 林下与林窗生长季平均温度的差异ꎮ ∗∗∗表示 P<0.001ꎮ
A. The change trend of understory temperature in one yearꎻ B. The difference between understory and forest gap of mean temperature of growing
season. ∗∗∗ indicates P<0.001.
图 2 林下微气候特征
Fig. 2 Characteristics of understory microclimate
表 1 样地环境因子基本特征
Table 1 Basic characteristics of environmental factors in plots
生长季平均温度 生长季平均土壤湿度
样地编号 草本植物盖度 林冠郁闭度 土壤酸碱度 Mean temperature Mean soil moisture
Plot No. Herbaceous coverage Canopy cover Soil pH of growing season of growing season
(℃ ) (%)
P1 104.25 0.18 6.97 21.21 26.15
P2 144.50 0.18 7.32 20.87 25.15
P3 86.50 0.33 7.39 19.36 31.28
P4 163.15 0.04 7.20 20.40 17.93
P5 182.98 0.35 7.14 17.77 27.76
P6 132.55 0.28 7.06 17.53 34.54
P7 137.00 0.05 7.37 19.06 32.64
P8 156.00 0.44 7.22 16.64 35.42
P9 92.08 0.17 6.68 17.73 27.55
WTM10 141.28 0.04 6.59 16.86 34.49
WTM11 160.05 0.20 6.91 17.04 32.78
WTM12 142.75 0.33 7.67 17.29 34.49
WTM13 173.88 0.12 7.66 19.17 28.82
注:P. 野核桃沟保护区样地ꎻ WTM. 西天山保护区样地ꎮ
Note: P. The plot in the Wild Walnut Valley Reserveꎻ WTM. The plot in the West Tianshan Reserve.
活的重要性( Lai et al.ꎬ 2022)ꎮ 以上数据处理和 et al.ꎬ 2019)包完成ꎮ 使用“ggplot2”(Villanueva &
分析使用 R 语言中的“lme4”(Bates et al.ꎬ 2015)、 Chenꎬ 2019) 包完成制图ꎮ 所有统计分析与制图
“glmm.hp” ( Lai et al.ꎬ 2022) 和“ mgcv” ( Pedersen 均在 R 4.4.1 中完成ꎮ