


Page 123 - 《广西植物》2026年第6期
P. 123
1 0 3 8                                广  西  植  物                                         46 卷
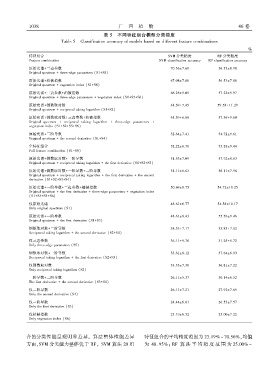
                                             表 5  不同特征组合模型分类精度
                           Table 5  Classification accuracy of models based on different feature combinations
                                                                                                           %
             特征组合                                                        SVM 分类精度             RF 分类精度
             Feature combination                                     SVM classification accuracy  RF classification accuracy
             原始光谱+三边参数                                                    70.56±7.60          56.53±8.98
             Original spectrum + three ̄edge parameters (S1+S5)
             原始光谱+植被指数                                                    67.08±7.86          56.53±7.88
             Original spectrum + vegetation index (S1+S6)
             原始光谱+三边参数+植被指数                                               66.25±9.09          57.22±9.97
             Original spectrum + three ̄edge parameters + vegetation index (S1+S5+S6)
             原始光谱+倒数取对数                                                   61.39±7.45          59.58±11.29
             Original spectrum + reciprocal taking logarithm (S1+S2)
             原始光谱+倒数取对数+三边参数+植被指数                                         61.39±6.88          57.36±9.60
             Original spectrum + reciprocal taking logarithm + three ̄edge parameters +
             vegetation index (S1+S2+S5+S6)
             原始光谱+二阶导数                                                    52.64±7.41          54.72±9.61
             Original spectrum + the second derivative (S1+S4)
             全特征组合                                                        52.22±6.70          55.28±9.44
             Full feature combination (S1-S6)
             原始光谱+倒数取对数+一阶导数                                              51.53±7.09          57.92±8.63
             Original spectrum + reciprocal taking logarithm + the first derivative (S1+S2+S3)
             原始光谱+倒数取对数+一阶导数+二阶导数                                         51.11±6.63          56.11±7.96
             Original spectrum + reciprocal taking logarithm + the first derivative + the second
             derivative (S1+S2+S3+S4)
             原始光谱+一阶导数+三边参数+植被指数                                          50.69±8.75          54.72±10.25
             Original spectrum + the first derivative + three ̄edge parameters + vegetation index
             (S1+S3+S5+S6)
             仅原始光谱                                                        48.61±6.77          54.58±10.17
             Only original spectrum (S1)
             原始光谱+一阶导数                                                    48.61±8.43          55.56±9.46
             Original spectrum + the first derivative (S1+S3)
             倒数取对数+二阶导数                                                   38.33±7.17          35.83±7.02
             Reciprocal taking logarithm + the second derivative (S2+S4)
             仅三边参数                                                        36.11±9.76          31.25±8.72
             Only three ̄edge parameters (S5)
             倒数取对数+一阶导数                                                   33.61±8.12          37.64±6.93
             Reciprocal taking logarithm + the first derivative (S2+S3)
             仅倒数取对数                                                       33.33±7.30          36.81±7.22
             Only reciprocal taking logarithm (S2)
             一阶导数+二阶导数                                                    26.11±5.37          30.14±6.52
             The first derivative + the second derivative (S3+S4)
             仅二阶导数                                                        26.11±7.21          27.92±7.69
             Only the second derivative (S4)
             仅一阶导数                                                        24.44±6.61          26.53±7.57
             Only the first derivative (S3)
             仅植被指数                                                        23.19±6.52          25.00±7.22
             Only vegetation index (S6)


            合的分类性能呈现明显差异ꎮ 算法整体性能差异                             特征组合的平均精度范围为 23.19% ~ 70.56%ꎬ均值
            方面ꎬSVM 分类能力整体优于 RFꎮ SVM 算法 20 组                    为 48. 95%ꎻ RF 算 法 平 均 精 度 范 围 为 25.00% ~

