
Page 30 - 《广西植物》2020年第8期
P. 30
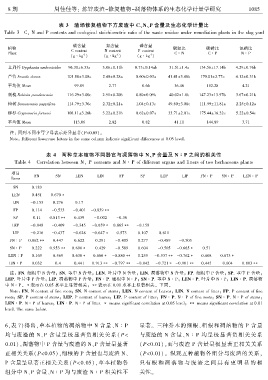
8 期              周佳佳等: 炼锌废渣-修复植物-凋落物体系的生态化学计量学研究                                          1 0 8 5


                       表 3  渣场修复植物下方废渣中 C、N、P 含量及生态化学计量比
   Table 3  Cꎬ N and P contents and ecological stoichiometric ratio of the waste residue under remediation plants in the slag yard

                            碳含量          氮含量         磷含量
    植物                                                            碳氮比         碳磷比          氮磷比
                            C content   N content    P content
    Plant                                                         C ∶ N        C ∶ P       N ∶ P
                                              ̄1
                                 ̄1
                                                          ̄1
                           (gkg )     (gkg )    (gkg )
    土荆芥 Dysphania ambrosioides  96.30±6.33a  3.06±0.11b  0.73±0.14ab  31.51±1.4a  134.56±17.14b  4.29±0.76b
    芦竹 Arundo donax       101.88±3.08a  2.48±0.28a  0.60±0.03a  41.41±3.46b  170.01±2.77c  4.12±0.31b
    平均值 Mean                 99.09        2.77        0.66        36.46       152.28        4.21
    刺槐 Robinia pseudoacacia  116.29±3.00c  2.91±0.20b  0.80±0.09b  40.02±1.8b  147.23±13.97b  3.67±0.21b
    构树 Broussonetia papyrifera  114.79±3.36c  2.32±0.21a  1.04±0.13c  49.60±3.08c  111.99±11.81a  2.25±0.12a
    柳杉 Cryptomeria fortunei  108.11±3.26b  3.22±0.21b  0.62±0.07a  33.71±2.01a  175.44±16.32c  5.22±0.54c
    平均值 Mean                 113.06       2.82        0.82        41.11       144.89        3.71

     注: 同列不同小写字母表示差异显著(P<0.05)ꎮ
     Note: Different lowercase letters in the same column indicate significant differences at 0.05 level.


                  表 4  两种草本植物不同器官与凋落物中 N、P 含量及 N ∶ P 之间的相关性
       Table 4  Correlation between Nꎬ P contents and N ∶ P of different organs and litters of two herbaceous plants
     项目
              FN      SN     LEN     LIN      FP      SP     LEP     LIP    FN ∶ P  SN ∶ P  LEN ∶ P
     Items
      SN     0.189
     LEN     0.451  0.670∗
      LIN   -0.153   0.276   0.17
      FP     0.114  -0.533  -0.401  -0.839∗∗
      SP     0.11   0.813∗∗  0.439  -0.002   -0.36
      LEP   -0.048  -0.409  -0.345  -0.659∗  0.865∗∗  -0.158
      LIP   -0.216  -0.437  -0.628  -0.647∗  0.573   0.107   0.611
     FN ∶ P  0.862∗∗  0.447  0.622   0.291  -0.405   0.277  -0.489  -0.503
     SN ∶ P  0.222  0.953∗∗  0.696∗  0.429  -0.589   0.604  -0.505  -0.665∗  0.51
    LEN ∶ P  0.169   0.569  0.638∗  0.666∗  -0.880∗∗  0.259  -0.937∗∗ -0.762∗  0.608  0.673∗
    LIN ∶ P  0.032    0.4    0.441  0.913∗∗ -0.797∗∗  -0.042  -0.721∗ -0.901∗∗  0.445  0.604  0.803∗∗

     注: FN. 细根中 N 含量ꎻ SN. 茎中 N 含量ꎻ LEN. 叶片中 N 含量ꎻ LIN. 凋落物中 N 含量ꎻ FP. 细根中 P 含量ꎻ SP. 茎中 P 含量ꎻ
   LEP. 叶片中 P 含量ꎻ LIP. 凋落物中 P 含量ꎻ FN ∶ P. 细根中 N ∶ Pꎻ SN ∶ P. 茎中 N ∶ Pꎻ LEN ∶ P. 叶片中 N ∶ Pꎻ LIN ∶ P. 凋落物
   中 N ∶ Pꎮ ∗表示在 0.05 水平上显著相关ꎻ ∗∗表示在 0.01 水平上显著相关ꎮ 下同ꎮ
     Note: FN. N content of fine rootsꎻ SN. N content of stemsꎻ LEN. N content of Leavesꎻ LIN. N content of litterꎻ FP. P content of fine
   rootsꎻ SP. P content of stemsꎻ LEP. P content of leavesꎻ LIP. P content of litterꎻ FN ∶ P. N ∶ P of fine rootsꎻ SN ∶ P. N ∶ P of stemsꎻ
   LEN ∶ P. N ∶ P of leavesꎻ LIN ∶ P. N ∶ P of litter. ∗ means significant correlation at 0.05 levelꎻ ∗∗ means significant correlation at 0.01
   level. The same below.


   6ꎬ表 7)得出ꎬ草本植物的凋落物中 N 含量、N ∶ P                     显著ꎮ 三种乔木的细根、粗根和凋落物的 P 含量
   均与废渣的 N、P 含量呈极显著负相关关系( P <                        与废渣的 N 含量、N ∶ P 均呈极显著负相关关系
   0.01)ꎬ凋落物中 P 含量与废渣的 N、P 含量呈显著                     (P<0.01)ꎬ而与废渣 P 含量呈极显著正相关关系
   正相关关系(P<0.05)ꎬ细根的 P 含量也与废渣 N、                     (P<0.01)ꎮ 纵观五种植物各组分与废渣的关系ꎬ
   P 含量呈显著正相关关系( P<0.05)ꎬ草本植物各                       只有 根 和 凋 落 物 与 废 渣 之 间 具 有 更 明 显 的 相
   组分中 N、P 含量、N ∶ P 均与废渣 N ∶ P 相关性不                  关性ꎮ