
Page 101 - 《广西植物》2022年第12期
P. 101
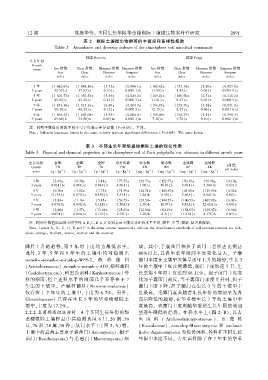
12 期                 冼康华等: 不同生长年限华重楼根际土壤微生物多样性研究                                          2 0 9 1

                                      表 2  根际土壤微生物群落的丰富度和多样性指数
                         Table 2  Abundance and diversity indexes of the rhizosphere soil microbial community

                                       细菌 Bacteria                                  真菌 Fungi
              生长年份
               Growth
                         Ace 指数    Chao 指数   Shannon 指数 Simpson 指数  Ace 指数    Chao 指数   Shannon 指数  Simpson 指数
                years
                           Ace       Chao      Shannon   Simpson      Ace       Chao      Shannon    Simpson
                          index      index      index     index      index      index      index      index
                3 年     (1 062.69±  (1 088.86±  (5.73±   (0.006 1±  (160.62±   (159.10±   (1.89±    (0.427 1±
               3 years   32.53)d    37.67)d    0.10)c    0.000 1)b  11.55)a    8.43)a     0.06)d    0.005 9)a
                5 年     (1 303.77±  (1 353.53±  (5.34±   (0.024 2±  (169.01±   (166.58±   (2.51±    (0.310 2±
               5 years   45.62)c    43.22)c    0.13)d    0.000 3)a  11.21)a    6.37)a     0.03)b    0.000 9)c
                7 年     (1 853.30±  (1 915.16±  (6.49±   (0.003 0±  (156.85±   (155.35±   (3.28±    (0.071 1±
               7 years   50.38)a    48.25)a    0.12)a    0.000 2)c  12.15)a    8.27)a     0.06)a    0.001 6)d
                9 年     (1 603.52±  (1 607.08±  (5.93±   (0.006 4±  (155.40±   (154.75±   (2.12±    (0.396 3±
               9 years   29.66)b    33.56)b    0.09)bc   0.000 1)b   7.30)a    4.70)a     0.10)c    0.002 1)b
              注: 同列中数值后面的不同小写字母表示差异显著 (P<0.05)ꎮ 下同ꎮ
              Note: Different lowercase letters in the same column indicate significant differences (P<0.05). The same below.


                                       表 3  不同生长年限华重楼根际土壤的理化性质
            Table 3  Physical and chemical properties in the rhizosphere soil of Paris polyphylla var. chinensis in different growth years

              生长年份       全氮        全磷       全钾      总有机碳       铵态氮       硝态氮      速效磷       速效钾       pH 值
               Growth     TN       TP        TK       TOC       AN        NN        AP       AK
                                                                              ̄1
                             ̄1
                                                                                                 ̄1
                                                                                        ̄1
                                                 ̄1
                                                          ̄1
                                                                    ̄1
                                       ̄1
                years  (gkg )  (gkg )  (gkg )  (gkg )  (mgkg )  (mgkg )  (mgkg )  (mgkg )  pH value
                3 年     (2.69±    (0.78±    (3.18±   (77.57±   (32.73±  (152.77±  (50.39±  (99.98±    (4.10±
               3 years  0.10A)bc  0.06C)c  0.08F)d   4.90A)a   1.90)a   11.01)b   2.60A)c  7.34D)b    0.03)d
                5 年     (6.30±    (1.62±    (7.75±   (71.59±   (24.71±  (180.67±  (45.66±  (129.95±   (4.52±
               5 years  0.13A)a   0.07A)a  0.13E)b   5.53A)a   1.24)b    8.59)a   3.60A)c  6.84C)b    0.02)c
                7 年     (2.84±    (1.16±    (5.18±   (59.75±   (23.54±  (144.27±  (100.53±  (407.92±  (6.02±
               7 years  0.07A)b   0.09A)b  0.12E)c   3.58A)b   1.38)b   11.57)b   5.89A)b  22.62A)a   0.04)b
                9 年     (2.60±    (1.57±   (13.16±   (25.63±   (22.00±  (63.19±  (158.95±  (125.97±   (6.96±
               9 years  0.07A)c   0.09A)a  0.17C)a   2.75C)c   1.20)b    4.11)c  11.61A)a  8.17C)b    0.07)a
              注: 同列中数值后面的不同字母 A、B、C、D、E、F 分别表示土壤养分评价水平丰富、较丰、中等、较缺、缺乏和极缺ꎮ
              Note: Letters Aꎬ Bꎬ Cꎬ Dꎬ E and F in the same column respectively indicate the classification standards of soil nutrient contents are richꎬ
            above averageꎬ mediumꎬ scarceꎬ scarcer and the scarcest.
            降后上升的趋势ꎬ第 7 年时丰度均为最低水平ꎮ                            成ꎮ 其中ꎬ子囊菌门和担子菌门二者所占比例达
            此外ꎬ3 年、5 年 和 9 年 生 的 土 壤 中 均 可 检 测 出               80%以上ꎬ且各生长年限间丰度变化最大ꎮ 子囊
            norank ̄o ̄norank ̄c ̄norank ̄p ̄WPS ̄2、 酸 热 菌 科          菌门丰度在土壤中大体呈逐年上升的趋势ꎬ生长 3
            (Acidothermaceae)、norank ̄o ̄norank ̄c ̄AD3、柄杆菌科       年的土壤中丰度比例最低ꎬ随后丰度快速上升ꎬ生
            (Caulobacteraceae)、科里氏菌科(Koribacteraceae) 等        长至第 9 年时丰度达到 88.11%ꎮ 担子菌门丰度变
            科的细菌ꎬ但上述科水平的细菌几乎不存在于 7                             化与子囊菌门相反ꎬ当子囊菌门丰度上升时ꎬ担子
            年生的土壤中ꎮ 产碱杆菌科( Nitrosomonadaceae)                  菌门丰度下降ꎬ担子菌门在生长 3 年的土壤中丰
            仅存在于 7 年生的土壤中ꎬ丰度为 6.7%ꎮ 另外ꎬ                        度最高ꎮ 毛霉门真菌随着生长年份的增加呈先升
            Clostridiaceae ̄1 只存在生长 5 年的华重楼根际土                  高后降低的趋势ꎬ在华重楼生长 7 年的土壤中丰
            壤中ꎬ丰度为 17.2%ꎮ                                      度最高ꎮ 壶菌门丰度则随华重楼生长年限的增加
            2.2.2 真菌群落组成分析  4 个不同生长年份的华                        呈逐年降低的趋势ꎮ 在科水平上( 图 2:B)ꎬ以古
            重楼根际土壤样品中共检测真菌 8 门、26 纲、56                         生 菌 科 ( Archaeorhizomycetaceae )、 红 菇 科
            目、76 科、78 属、96 种ꎮ 从门水平上( 图 2:A) 看ꎬ                 ( Russulaceae)、 norank ̄p ̄Mucoromycota 和 unclassi ̄
            土壤中的真菌主要由子囊菌门( Ascomycota)、担子                      fied ̄c ̄Agaricomycetes 为优势菌科ꎬ各科在不同生长
            菌门( Basidiomycota) 与 毛 霉 门 ( Mucoromycota) 组       年限中丰度不同ꎮ 古生菌科除了在 7 年生的华重