Page 54 - 《广西植物》2025年第8期
P. 54

1 4 2 0                                广  西  植  物                                         45 卷


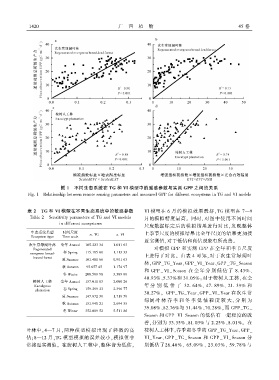
                           图 1  不同生态系统在 TG 和 VI 模型中的遥感参数与实测 GPP 之间的关系
             Fig. 1  Relationship between remote sensing parameters and measured GPP for different ecosystems in TG and VI models


             表 2  TG 和 VI 模型在不同生态系统中的敏感参数                      VI 模型在 6 月的模拟效果最好ꎬTG 模型在 7—9
              Table 2  Sensitivity parameters of TG and VI models  月的模拟精度最高ꎮ 同时ꎬ对图中使用不同时间
                          in different ecosystems
                                                               尺度数据标定后的模拟结果进行对比ꎬ发现整体
              生态系统类型        时间尺度                               上季节尺度的模拟结果比全年尺度的结果更加接
                                       m_TG        a_VI
              Ecosystem type  Time scale
                                                               近实测值ꎬ对于低估和高估现象有所改善ꎮ
             次生常绿阔叶林       全年 Annual  105.223 34  1.011 63
               Regenerated                                         对模拟 GPP 和实测 GPP 在全年和季节尺度
                            春 Spring  115.105 60  1.113 33
              evergreen broad ̄                                 上进行了对比ꎮ 由表 4 可知ꎬ对于次生常绿阔叶
               leaved forest
                            夏 Summer  101.481 66  0.901 63
                                                               林ꎬGPP_TG_Year、GPP_VI_Year、GPP_TG_Season
                            秋 Autumn  95.657 45  1.174 97
                                                               和 GPP _ VI _ Season 在 全 年 分 别 低 估 了 8. 43%、
                            冬 Winter  208.580 98  3.389 80
                                                               40.93%、5.37%和 31.05%ꎻ对于桉树人工林ꎬ在全
               桉树人工林       全年 Annual  157.011 83  2.080 26
                Eucalyptus                                     年 分 别 低 估 了 32. 64%、 47. 89%、 21. 39% 和
                            春 Spring  159.299 23  2.396 77
                plantation
                                                               30.27%ꎮ GPP_TG_Year、GPP _VI_Year 在次生常
                            夏 Summer  147.672 30  1.718 50
                                                               绿阔 叶 林 春 季 和 冬 季 低 估 程 度 较 大ꎬ 分 别 为
                            秋 Autumn  151.940 21  2.694 55
                                                               39.08%、82.76%与 31.44%、70.28%ꎬ而 GPP_TG_
                            冬 Winter  352.089 52  5.511 86
                                                               Season 和 GPP_VI_Season 的低估有一定程度的改
                                                               善ꎬ分别为 33.35%、81.03%与 2.25%、8.01%ꎮ 在
            叶林中ꎬ4—7 月ꎬ两种模型模拟出现了轻微的高                            桉树人工林中ꎬ春季和冬季的 GPP_TG_Year、GPP_
            估ꎻ8—12 月ꎬTG 模型模拟的误差较小ꎬ模拟值非                         VI_Year、GPP _TG_Season 和 GPP _VI_Season 分
            常接近实测值ꎮ 在桉树人工林中ꎬ整体皆为低估ꎬ                            别低估了26.40%、 65.09%、 23.03%、 59.78%与
   49   50   51   52   53   54   55   56   57   58   59