
Page 95 - 《广西植物》2025年第10期
P. 95
10 期 黄丽平等: 基于 HPLC 指纹图谱和化学模式识别的广东神曲质量评价 1 8 2 5
表 3 广东神曲中 5 个成分的含量测定结果(平均值±标准差)
Table 3 Content determination results of five components in Guangdong Shenqu (x±s)
 ̄1
mgg
批次 芦丁 鞣花酸 橙皮苷 阿魏酸 黄芩苷
Batch Rutin Ellagic acid Hesperidin Ferulic acid Baicalin
S1 4.615 7±0.031 0.576 2±0.013 1.259 6±0.036 0.032 6±0.002 0.662 4±0.008
S2 5.650 9±0.175 0.567 5±0.025 2.789 2±0.233 0.022 2±0.002 0.691 8±0.020
S3 5.563 6±0.042 0.731 1±0.008 2.576 5±0.084 0.050 3±0.000 0.709 4±0.008
S4 5.797 5±0.039 0.629 3±0.015 3.935 3±0.172 0.042 8±0.002 0.788 0±0.008
S5 5.096 2±0.052 0.705 7±0.023 2.572 0±0.128 0.072 9±0.002 0.676 8±0.008
S6 5.419 3±0.493 0.657 1±0.026 2.971 5±0.271 0.061 4±0.010 0.606 3±0.004
S7 4.740 8±0.023 0.701 9±0.012 2.632 7±0.239 0.043 0±0.006 0.778 6±0.007
S8 4.859 5±0.002 0.461 7±0.029 3.786 6±0.184 0.065 7±0.002 0.700 2±0.005
S9 5.177 9±0.066 0.661 4±0.020 3.074 1±0.116 0.085 4±0.002 0.633 8±0.013
S10 4.887 3±0.012 0.584 8±0.013 1.415 4±0.076 0.038 0±0.001 0.666 6±0.003
S11 4.555 7±0.367 0.220 5±0.010 2.620 8±0.162 0.063 3±0.039 0.316 9±0.108
S12 5.284 3±0.199 0.907 0±0.043 3.782 5±0.358 0.093 8±0.021 0.503 3±0.017
S13 4.481 0±0.267 0.646 8±0.215 2.208 0±0.310 0.073 0±0.008 0.522 9±0.051
S14 3.457 2±0.127 0.421 1±0.033 2.359 6±0.287 0.357 8±0.003 0.691 5±0.013
S15 6.773 7±0.236 0.836 7±0.064 2.656 9±0.521 0.330 9±0.009 0.347 3±0.112
S16 3.539 2±0.312 0.296 7±0.130 2.555 1±0.501 0.026 5±0.002 0.648 8±0.012
S17 5.026 4±0.081 0.533 6±0.010 3.645 7±0.127 0.038 3±0.003 0.520 4±0.058
S18 5.690 3±0.180 0.770 1±0.009 3.770 0±0.353 0.076 7±0.002 0.647 8±0.038
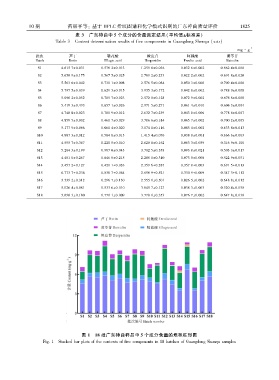
图 1 18 批广东神曲样品中 5 个成分含量的堆积柱形图
Fig. 1 Stacked bar plots of the contents of five components in 18 batches of Guangdong Shenqu samples