
Page 25 - 《广西植物》2020年第6期
P. 25
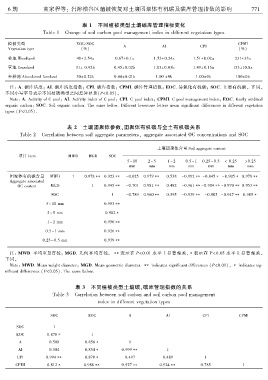
6 期          蓝家程等: 岩溶槽谷区植被恢复对土壤团聚体有机碳及碳库管理指数的影响                                            7 7 1


                                表 1  不同植被类型土壤碳库管理指标变化
                 Table 1  Change of soil carbon pool management index in different vegetation types

    植被类型                      EOC / SOC                                                   CPMI
                                               A              AI            CPI
    Vegetation type            (%)                                                        (%)
    林地 Woodland               40±3.54a      0.67±0.1a      1.53±0.24a    1.51±0.02a      231±33a

    草地 Grassland             31± 0.92b      0.45±0.02b     1.03±0.03b    1.49±0.15a     153±10.8a
    弃耕地 Abondoned farmland    30±0.22b      0.44±0.01b     1.00 ±0b       1.00±0b        100±0b
     注: A. 碳库活度ꎻ AI. 碳库活度指数ꎻ CPI. 碳库指数ꎻ CPMI. 碳库管理指数ꎻ EOC. 易氧化有机碳ꎻ SOC. 土壤有机碳ꎮ 下同ꎮ
   不同小写字母表示不同植被类型之间差异显著(P<0.05)ꎮ
     Note: A. Activity of C poolꎻ AI. Activity index of C poolꎻ CPI. C pool indexꎻ CPMI. C pool management indexꎻ EOC. Easily oxidized
   organic carbonꎻ SOC. Soil organic carbon. The same below. Different lowercase letters mean significant differences in different vegetation
   types (P<0.05).

                          表 2  土壤团聚体参数、团聚体有机碳与全土有机碳关系
        Table 2  Correlation between soil aggregate parametersꎬ aggregate associated OC concentrations and SOC

                                                            土壤团聚体含量 Soil aggregate content
        项目 Item            MWD    MGD     SOC
                                                 5~ 10  2~ 5    1 ~ 2  0.5 ~ 1  0.25 ~ 0.5  < 0.25  >0.25
                                                 mm      mm     mm      mm     mm     mm      mm

     团聚体有机碳含量       MWD     1    0.978∗∗ 0.923∗∗  -0.625  0.979∗∗  0.538  -0.992∗∗ -0.845∗ -0.905∗ 0.978∗∗
     Aggregate associated
        OC content  MGD            1    0.945∗∗  -0.701  0.981∗∗  0.482  -0.961∗∗-0.904∗∗-0.970∗∗ 0.953∗∗
                    SOC                    1    -0.789  0.960∗∗  0.395  -0.939∗∗ -0.805 -0.947∗∗ 0.905∗
                  5 ~ 10 mm             0.953∗∗
                   2 ~ 5 mm             0.902∗

                   1 ~ 2 mm             0.956∗∗
                  0.5 ~ 1 mm            0.926∗∗
                 0.25 ~ 0.5 mm          0.939∗∗

     注: MWD. 平均重量直径ꎻ MGD. 几何平均直径ꎮ ∗∗表示在 P< 0.01 水平上显著相关ꎬ∗表示在 P< 0.05 水平上显著相关ꎮ
   下同ꎮ
     Note: MWD. Mean weight diameterꎻ MGD. Mean geometric diameter. ∗∗ indicates significant differences (P<0.01)ꎬ ∗ indicates sig ̄
   nificant differences (P<0.05). The same below.

                             表 3  不同植被类型土壤碳、碳库管理指数的关系
                     Table 3  Correlation between soil carbon and soil carbon pool management
                                      index in different vegetation types

                    SOC           EOC            A             AI            CPI          CPMI

       SOC           1
       EOC         0.878∗          1
        A          0.508         0.858∗          1
        AI         0.504         0.854∗        0.999∗∗         1
       CPI        0.994∗∗        0.870∗         0.497         0.489           1
       CPMI        0.812∗       0.988∗∗        0.927∗∗       0.924∗∗        0.785           1