
Page 118 - 《广西植物》2022年第3期
P. 118
4 6 2 广 西 植 物 42 卷
物种分布模型因其可以准确预测和分析物种 (Cyclobalanopsis glauca) 和滇青冈 ( C. glaucoides)
的适宜生境范围ꎬ模型运行稳定ꎬ还可揭示植被分 为研究对象ꎬ收集标本分布点数据ꎬ结合气候变
布的影响气候变量ꎬ所以被广泛应用于生态学、保 量ꎬ运用 MaxEnt 模型ꎬ模拟预测两者的适生区范
护生物学和生物地理学等领域( Elith & Leathwickꎬ 围ꎬ分析造成两个树种生态位分化的气候因素ꎬ进
2009)ꎮ 目前ꎬ最大熵模型( MaxEnt)、基于遗传算 而探讨湿润与半湿润常绿阔叶林的替代分布格局
法的规则组合模型( GARP)、CLIMEX 模型、生态 及其与气候条件的相互关系ꎬ揭示其替代分布的
位因子分析模型( ENFA) 以及生物气候分析和预 主导因素ꎬ从而为亚热带常绿阔叶林分布和影响
测系统模型(BIOCLIM) 是最常用的五种物种分布 机制研究提供重要的科学依据ꎮ
模型ꎮ 其中ꎬMaxEnt 模型可以通过物种的已知分
布数据和气候变量建立物种地理分布与气候之间 1 材料与方法
的联系(Phillips et al.ꎬ 2008)ꎬ且能在大尺度空间
上获取更多的物种信息ꎬ为建立系统全面的物种 1.1 标本点数据
与环境的关系提供更为丰富的环境信息( 庄鸿飞 收集中国数字植物标本数据库( CVHꎬhttp:/ /
等ꎬ2018)ꎬ是目前物种分布模拟中认可度最高、拟 www.cvh.org.cn)中青冈与滇青冈的标本信息ꎬ筛除
合度较好的模型( Phillips et al.ꎬ 2006ꎻ曹向锋等ꎬ 样本采集地存疑和出现重复的样点ꎬ获取精确样本
2010)ꎮ 记录地点的经纬度坐标ꎬ作为物种生境模拟的基础
基于优势种的生态位模拟及差异分析ꎬ揭示 数据ꎮ 共获取两个物种 603 个标本点ꎬ其中包括
造成其分布差异的气候制约因素ꎬ尤其是气候季 432 个青冈标本点和 171 个滇青冈标本点(图 1:D)ꎮ
节性变化的影响机制对于阐明中国东西部两类地 1.2 气候变量数据
带性常绿阔叶林植被亚型的替代分布规律具有重 通过 Worldclim(http: / / www.worldclim.org / )下
要理论和实践意义ꎮ 鉴于此ꎬ本研究选择湿润和 载收集 19 个生物气候图层( 表 1)ꎬ数据空间分辨
半湿润常绿阔叶林中具有代表性的优势树种青冈 率为 30″(Hijmans et al.ꎬ 2005)ꎮ
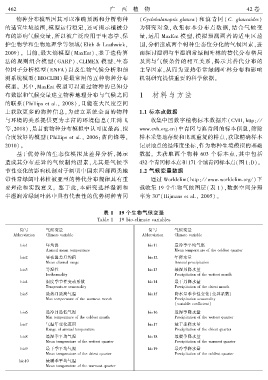
表 1 19 个生物气候变量
Table 1 19 bio ̄climate variables
简写 气候变量 简写 气候变量
Abbreviation Climate variable Abbreviation Climate variable
bio1 年均温 bio11 最冷季平均气温
Annual mean temperature Mean temperature of the coldest quarter
bio2 昼夜温差月均值 bio12 年降水量
Mean diurnal range Annual precipitation
bio3 等温性 bio13 最湿月降水量
Isothermality Precipitation of the wettest month
bio4 温度季节性变动系数 bio14 最干月降水量
Temperature seasonality Precipitation of the driest month
bio5 最热月最高气温 bio15 降水量季节性变化(变异系数)
Max temperature of the warmest month Precipitation seasonality
(variable coefficient)
bio6 最冷月最低气温 bio16 最湿季降水量
Min temperature of the coldest month Precipitation of the wettest quarter
bio7 气温年变化范围 bio17 最干季降水量
Range of annual temperature Precipitation of the driest quarter
bio8 最湿季平均气温 bio18 最暖季降水量
Mean temperature of the wettest quarter Precipitation of the warmest quarter
bio9 最干季平均气温 bio19 最冷季降水量
Mean temperature of the driest quarter Precipitation of the coldest quarter
bio10 最暖季平均气温
Mean temperature of the warmest quarter