


Page 133 - 《广西植物》2026年第7期
P. 133
7 期               刘城等: ZnO ̄NPs+SiO  ̄NPs 提高洋桔梗幼苗抗温度胁迫能力的研究                                 1 2 2 9
                                                   2
                                                表 3  正交试验设计及结果
                                        Table 3  Orthogonal experimental design and result

                                                          地上相对        地下相对
                                                           含水量         含水量       叶绿素含量
              试验号        A       B        C       D                               Chlorophyll  株高      得分
               Test    浓度       次数      配比       空白      Relative water  Relative water     Plant height
                                                          content of  content of   content             Score
              number  Concentration  Times  Proportion  Blank                                (cm)
                                                                                        ̄1
                                                         aboveground  underground  (mgg )
                                                           (%)          (%)
                1        1       1        1       1        85.72        83.09       0.76      15.3     80.46
                2        1       2        2       2        84.27        90.76       0.85      17.9     99.95∗
                3        1       3        3       3        82.61        84.33       0.66      17.5     80.95
                4        2       1        2       3        72.94        79.24       0.72      16.5     81.96
                5        2       2        3       1        85.66        81.19       0.71      12.8     64.70
                6        2       3        1       2        85.31        72.73       0.60      14.2     60.67
                7        3       1        3       2        87.23        83.42       0.57      12.4     50.32
                8        3       2        1       3        82.32        76.35       0.59      13.4     56.31
                9        3       3        2       1        80.25        78.19       0.60      17.4     75.35
                K1     261.35  212.74   197.44  220.51
                K2     207.33  220.96   257.26  210.94
                K3     181.98  216.96   195.96  219.22
                k1     87.13    70.91   65.81    73.50
                k2     69.11    73.65   85.75    70.31
                k3     60.66    72.32   65.32    73.07
                R      26.46    2.75    20.43    3.19
              注: K1、K2、K3 代表某一因素在不同水平下所有指标值的总和ꎻ k1、k2、k3 代表某一因素在不同水平下所有指标值的平均值ꎻ 得
            分 = 地上部分相对含水量得分 × 25% + 地下部分相对含水量得分 × 25% + 叶绿素含量得分 × 25% + 株高得分 × 25%ꎻ∗表示得
            分最高的组ꎮ
              Note: K1ꎬ K2ꎬ and K3 represent the sum of all indicator values for a certain factor at different levelsꎻ k1ꎬ k2ꎬ and k3 represent the
            average of all indicator values for a certain factor at different levelsꎻ score = score of relative water content of above ̄ground × 25% + score of
            relative water content of under ̄ground × 25% + score of chlorophyll content × 25% + score of plant height × 25%ꎻ ∗ indicates the group
            with the highest score.


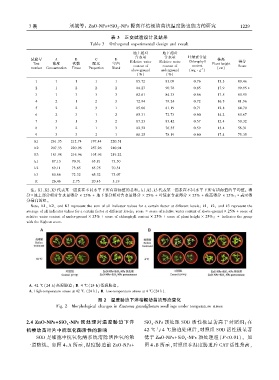
             A. 42 ℃ (24 h)高温胁迫ꎻ B. 4 ℃ (24 h)低温胁迫ꎮ
             A. High ̄temperature stress at 42 ℃ (24 h)ꎻ B. Low ̄temperature stress at 4 ℃(24 h).
                                           图 2  温度胁迫下洋桔梗幼苗的形态变化
                         Fig. 2  Morphological changes in Eustoma grandiflorum seedlings under temperature stress


            2.4 ZnO ̄NPs+SiO  ̄NPs 预处理对温度胁迫下洋                    SiO  ̄NPs 预处理 SOD 活性极显著高于对照组ꎻ在
                              2
                                                                  2
            桔梗幼苗叶片中抗氧化酶活性的影响                                   42 ℃ 与 4 ℃ 胁迫处理后ꎬ对照组 SOD 活性极显著
                 SOD 是细胞中抗氧化酶系统清除活性氧的第                         低于 ZnO ̄NPs+SiO  ̄NPs 预处理组( P<0.01)ꎮ 如
                                                                                2
            一道防线ꎮ 如图 4:A 所示ꎬ温度胁迫前 ZnO ̄NPs+                     图 4:B 所示ꎬ对照组在温度胁迫后 CAT 活性升高ꎬ

