Page 186 - 《广西植物》2023年第9期
P. 186

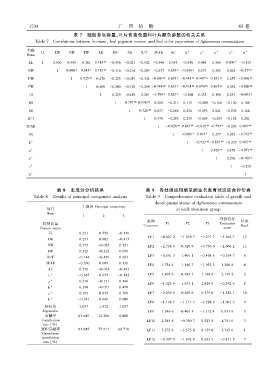
1 7 3 4                                广  西  植  物                                         43 卷
                                表 7  粗肋草生物量、叶片色素含量和叶片颜色参数的相关关系
                Table 7  Correlations between biomassꎬ leaf pigment content and leaf color parameters of Aglaonema commutatum

             名称
                  LL    LW    DW     FW    LB    RB     SB   R/ T  SPAD   AC    L ∗   a  ∗   b  ∗  c  ∗  h  ∗
             Name
             LL    1    0.550  0.545  0.381  0.714   -0.456  -0.021  -0.522  -0.546  0.453  -0.546  0.446  0.366  0.606   -0.553
             LW          1   0.608   0.645  0.715   -0.316  -0.216  -0.289  -0.537  0.655  -0.636   0.573  0.385  0.063  -0.577

             DW                1   0.925    0.476  -0.225  -0.059  -0.334 -0.869   0.695  -0.941   0.947   0.851    0.257 -0.896
             FW                      1    0.488  -0.200  -0.120  -0.298 -0.748   0.613  -0.914   0.870   0.867    0.034 -0.820
             LB                             1   -0.229  -0.450  -0.261 -0.585  0.623   -0.560  0.332  0.198  0.251  -0.603
             RB                                   1  -0.757   0.976    0.288  -0.211  0.113  -0.080  -0.166  -0.120  0.188
             SB                                         1   -0.728   0.057  -0.168  0.234  -0.093  0.041  -0.035  0.168
             R/ T                                             1    0.374  -0.263  0.239  -0.189  -0.293  -0.192  0.281
            SPAD                                                    1   -0.826   0.843   -0.818   -0.599  -0.233 0.969

             AC                                                            1  -0.666  0.693   0.277  0.035 -0.763
              ∗                                                                     -0.922  -0.853   -0.235 0.905
             L                                                                   1
              ∗
             a                                                                         1   0.826    0.178 -0.872
              ∗                                                                                        -0.701
             b                                                                               1    0.276
              ∗
             c                                                                                     1    -0.253
              ∗
             h                                                                                           1

                         表 8  主成分分析结果                          表 9  各处理组粗肋草的生长发育状况综合评价表
               Table 8  Results of principal component analysis  Table 9  Comprehensive evaluation table of growth and
                                                                   development status of Aglaonema commutatum
                                    主成分 Principal component
                     项目                                                     in each treatment group
                     Item
                                    1        2       3
                                                                                               评价得分
                                                                处理                                      位次
                   特征向量                                                 F1      F2       F3    Evaluation
                                                              Treatment                                 Rank
                  Feature vector                                                                score
                      LL           0.231   0.550   -0.130
                                                                LP1  -4.827 2  -1.438 7  -0.277 7  -3.862 7  12
                     LW            0.253   0.002   -0.415
                     DW            0.352   -0.065   0.121       LP2  -2.708 6  0.320 9  -0.736 0  -2.064 2  11
                     FW            0.329   -0.223   0.098
                                                                LP3  -0.651 3  1.401 1  -0.468 5  -0.334 7  6
                     R / T        -0.144   -0.429   0.283
                     SPAD         -0.330   0.009    0.130
                                                                LP4   1.754 4  1.146 7  -1.952 3  1.280 8  4
                      AC           0.276   -0.094  -0.493
                       ∗                                        LP5   2.498 6  0.984 3  1.144 6  2.138 2  2
                      L           -0.347   0.097   -0.142
                      a ∗          0.336   -0.171   0.146
                                                                LP6  -1.325 6  1.675 1  1.824 9  -0.562 9  8
                       ∗
                      b            0.290   -0.073   0.498
                      ∗                                         LP7  -2.239 0  0.269 6  0.579 0  -1.582 1  10
                      c            0.102   0.635    0.396
                       ∗
                      h           -0.341   0.049    0.008
                                                                LP8  -1.198 7  -1.111 3  -0.288 2  -1.091 3  9
                    特征值            7.637   1.472    1.057
                   Eigenvalue                                   LP9   1.346 6  0.401 5  -1.112 4  0.953 8  5
                    贡献率           63.645   12.266   8.808
                   Contribution                                 LP10  2.385 8  -0.380 7  0.523 8  1.791 0  3
                   rate (%)
                   累积贡献率          63.645   75.911  84.718       LP11  5.272 4  -1.575 8  0.139 0  3.745 6  1
                   Cumulative
                   contribution
                                                                LP12  -0.307 5  -1.692 8  0.623 9  -0.411 5  7
                   rate (%)
   181   182   183   184   185   186   187   188   189   190   191