
Page 105 - 《广西植物》2025年第8期
P. 105
8 期 王丽敏等: 气候变化下三种栎类光合系统高温适应性对其分布的影响 1 4 7 1
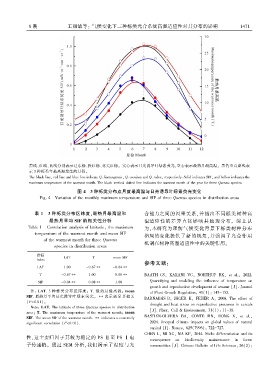
黑线、红线、蓝线分别表示辽东栎、猩红栎、北美红栎ꎮ 实心表示日光诱导叶绿素荧光ꎬ空心表示最热月最高温ꎮ 黑色垂直虚线表
示 3 种栎类年最高温发生的月份ꎮ
The black lineꎬ red line and blue line indicate Q. liaotungensisꎬ Q. coccinea and Q. rubraꎬ respectively. Solid indicates SIFꎬ and hollow indicates the
maximum temperature of the warmest month. The black vertical dotted line indicates the warmest month of the year for three Quercus species.
图 4 3 种栎类分布点月度最高温与日光诱导叶绿素荧光变化
Fig. 4 Variation of the monthly maximum temperature and SIF of three Quercus species in distribution areas
表 1 3 种栎类分布区纬度、最热月最高温和 合能力之间的因果关系ꎬ并指出不同栎类树种高
最热月平均 SIF 的相关性分析 温适应性的差异直接影响其地理分布ꎮ 综上认
Table 1 Correlation analysis of latitudeꎬ the maximum 为ꎬ本研究为理解气候变化背景下栎类树种分布
temperature of the warmest month and mean SIF
格局的变化提供了新的视角ꎬ并强调了光合作用
of the warmest month for three Quercus
机制在树种高温适应性中的关键作用ꎮ
species in distribution areas
指标
LAT T mean SIF
Index
参考文献:
LAT 1.00 -0.67∗∗ -0.04∗∗
T -0.67∗∗ 1.00 0.08∗∗ BAATH GSꎬ KAKANI VGꎬ NORTHUP BKꎬ et al.ꎬ 2022.
Quantifying and modeling the influence of temperature on
SIF -0.04∗∗ 0.08∗∗ 1.00
growth and reproductive development of sesame [J]. Journal
注: LAT. 3 种栎类分布区纬度ꎻ T. 最热月最高温ꎻ mean of Plant Growth Regulationꎬ 41(1): 143-152.
SIF. 最热月平均日光诱导叶绿素荧光ꎮ ∗∗表示极显著相关
BARNABÁS Bꎬ JÄGER Kꎬ FEHÉR Aꎬ 2008. The effect of
(P<0.01)ꎮ
drought and heat stress on reproductive processes in cereals
Note: LAT. The latitude of three Quercus species in distribution
[J]. Plantꎬ Cell & Environmentꎬ 31(1): 11-38.
areaꎻ T. The maximum temperature of the warmest monthꎻ mean
BASTIEN ̄OLVERA BAꎬ CONTE MNꎬ DONG Xꎬ et al.ꎬ
SIF. The mean SIF of the warmest month. ∗∗ indicates a extremely
2024. Unequal climate impacts on global values of natural
significant correlation (P<0.01).
capital [J]. Natureꎬ 625(7996): 722-727.
CHEN Lꎬ MI XCꎬ MA KPꎬ 2014. Niche differentiation and its
性ꎬ这主要归因于其较为稳定的 PS Ⅱ至 PS Ⅰ电
consequence on biodiversity maintenance in forest
子传递链ꎮ 通过 SEM 分析ꎬ我们揭示了温度与光 communities [J]. Chinese Bulletin of Life Sciencesꎬ 26(2):