
Page 106 - 《广西植物》2025年第8期
P. 106
1 4 7 2 广 西 植 物 45 卷
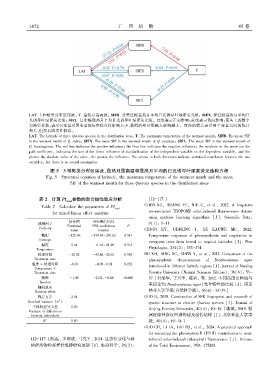
LAT. 3 种栎类分布区纬度ꎻ T. 最热月最高温ꎻ SIFB. 北美红栎最热月平均日光诱导叶绿素荧光值ꎻ SIFX. 猩红栎最热月平均日
光诱导叶绿素荧光值ꎻ SIFL. 辽东栎最热月平均日光诱导叶绿素荧光值ꎮ 红线表示正向影响ꎻ蓝线表示负向影响ꎻ箭头上的数字
为路径系数ꎬ表示自变量对因变量的标准化直接影响大小ꎬ数值的绝对值越大影响越大ꎮ 双向的箭头表示两个变量之间的统计
相关ꎬ但没有因果性假设ꎮ
LAT. The latitude of three Quercus species in the distribution areaꎻ T. The maximum temperature of the warmest monthꎻ SIFB. The mean SIF
in the warmest month of Q. rubraꎻ SIFX. The mean SIF in the warmest month of Q. coccineaꎻ SIFL. The mean SIF in the warmest month of
Q. liaotungensis. The red line indicates the positive influenceꎻ the blue line indicates the negative influenceꎻ the numbers on the arrow are the
path coefficientꎬ indicating the size of the direct influence of standardization of the independent variable on the dependent variableꎬ and the
greater the absolute value of the valueꎬ the greater the influence. The arrows in both directions indicate statistical correlation between the two
variablesꎬ but there is no causal assumption.
图 5 3 种栎类分布区纬度、最热月最高温和最热月平均的日光诱导叶绿素荧光结构方程
Fig. 5 Structural equation of latitudeꎬ the maximum temperature of the warmest month and the mean
SIF of the warmest month for three Quercus species in the distribution areas
表 2 计算 PI total 参数的混合线性效应分析 112-117.]
Table 2 Calculate the parameters of PI CHEN XGꎬ HUANG YFꎬ NIE Cꎬ et al.ꎬ 2022. A long ̄term
total
reconstructed TROPOMI solar ̄induced fluorescence dataset
for mixed linear effect analysis
using machine learning algorithms [ J ]. Scientific Dataꎬ
估计值 95%置信区间
预测因子 9(1): 1-11.
Estimated 95% confidence P
Predictor CROUS KYꎬ UDDLING Jꎬ DE KAUWE MGꎬ 2022.
value interval
截距 -125.96 -539.54~287.62 0.541 Temperature responses of photosynthesis and respiration in
Intercept
evergreen trees from boreal to tropical latitudes [ J]. New
温度 5.41 -11.16~21.98 0.512
Phytologistꎬ 234(2): 353-374.
Temperature
处理时间 -10.52 -43.66~22.63 0.524 DU XHꎬ DING XCꎬ CHEN Yꎬ et al.ꎬ 2012. Comparison of the
Treatment time
photosynthetic characteristics of Dendrocalamus asper
温度 × 处理时间 -0.01 -0.03~0.01 0.152
introduced in different latitude regions [J]. Journal of Nanjing
Temperature ×
Treatment time Forestry University (Natural Sciences Edition)ꎬ 36(6): 53-
物种 -1.45 -2.02~ -0.88 <0.001 57. [杜旭华ꎬ 丁兴萃ꎬ 陈岩ꎬ 等ꎬ 2012. 不同纬度引种地马
Species 来甜龙竹(Dendrocalamus asper)光合特性的比较 [J]. 南京
随机效应
林业大学学报(自然科学版)ꎬ 36(6): 53-57.]
Random effect
残差方差 2.41 GUO Bꎬ 2018. Construction of SSR fingerprint and research of
2
Residual variance (σ )
genetic structure in relative Quercus species [J]. Journal of
个体间差异方差 0.00 Beijing Forestry Universityꎬ 40(4): 10-18. [郭斌ꎬ 2018. 栎
Variance of differences
between individuals 属近缘种指纹图谱构建及遗传结构 [J]. 北京林业大学学
R 2 0.60 报ꎬ 40(4): 10-18.]
GUO CHꎬ LI LKꎬ LIU ZQꎬ et al.ꎬ 2024. A practical approach
for extracting the photosystemⅡ(PSⅡ) contribution to near ̄
112-117. [陈磊ꎬ 米湘成ꎬ 马克平ꎬ 2014. 生态位分化与森 infrared solar ̄induced chlorophyll fluorescence [J]. Science
林群落物种多样性维持研究展望 [J]. 生命科学ꎬ 26(2): of the Total Environmentꎬ 950: 175203.