


Page 58 - 《广西植物》2026年第6期
P. 58
6 期             余玲等: 广西森林 NDVI 的时空变化特征及其对干旱响应的敏感性分析                                         9 7 3


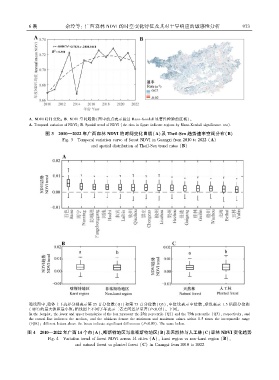
             A. NDVI 时间变化ꎻ B. NDVI 空间趋势(图中的点表示通过 Mann ̄Kendall 显著性检验的区域)ꎮ
             A. Temporal variation of NDVIꎻ B. Spatial trend of NDVI (the dots in figure indicate regions by Mann ̄Kendall significance test).
                    图 3  2010—2022 年广西森林 NDVI 的时间变化曲线(A)及 Theil ̄Sen 趋势速率空间分布(B)

                            Fig. 3  Temporal variation curve of forest NDVI in Guangxi from 2010 to 2022 (A)
                                        and spatial distribution of Theil ̄Sen trend rates (B)


             箱线图中ꎬ箱体上下边界分别表示第 25 百分位数( Q1) 和第 75 百分位数( Q3)ꎬ中位线表示中位数ꎬ虚线表示 1.5 倍四分位距
             (IQR)的最大值和最小值ꎻ箱线图上不同字母表示二者之间差异显著(P<0.05)ꎮ 下同ꎮ
             In the boxplotꎬ the lower and upper boundaries of the box represent the 25th percentile (Q1) and the 75th percentile (Q3)ꎬ respectivelyꎬ and
             the central line indicates the medianꎬ and the whiskers denote the minimum and maximum values within 1.5 times the interquartile range
             (IQR)ꎻ different letters above the boxes indicate significant differences (P<0.05). The same below.
             图 4  2010—2022 年广西 14 个市(A)、喀斯特地区与非喀斯特地区(B)及天然林与人工林(C)森林 NDVI 变化趋势
                     Fig. 4  Variation trend of forest NDVI across 14 cities (A)ꎬ karst region vs non ̄karst region (B)ꎬ
                                 and natural forest vs planted forest (C) in Guangxi from 2010 to 2022

