
Page 205 - 《广西植物》2025年第1期
P. 205
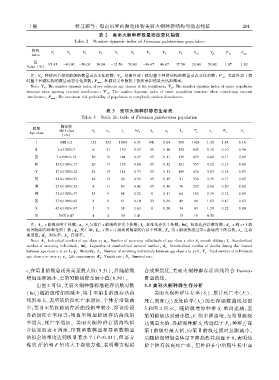
1 期                 桂慧颖等: 海南吊罗山濒危植物美丽火桐种群结构与动态特征                                            2 0 1

                                           表 2  美丽火桐种群数量动态变化指数
                                 Table 2  Number dynamic index of Firmiana pulcherrima population
               指标
                       V 1    V 2   V 3    V 4    V 5    V 6    V 7   V 8    V 9    V 1 0  V pi  V′ pi  P max
               Index
               值
                      95.45  -40.00  -50.00  30.00  -12.50  50.00  -46.67  46.67  37.50  20.00  59.02  1.07  1.82
            Value (%)
              注: V n . 种群两个相邻龄级的数量动态变化指数ꎻ V pi . 忽略外部干扰时整个种群结构的数量动态变化指数ꎻ V′ pi . 考虑外部干扰
            时整个种群结构的数量动态变化指数ꎻ P max . 种群对完全随机干扰所承担的最大风险概率ꎮ
              Note: V n . The number dynamic index of two adjacent age classes of the populationꎻ V pi . The number dynamic index of entire population
            structure when ignoring external interferenceꎻ V′ pi . The number dynamic index of entire population structure when considering external
            interferenceꎻ P max . The maximum risk probability of population to completely random disturbance.

                                              表 3  美丽火桐种群静态生命表
                                    Table 3  Static life table of Firmiana pulcherrima population
                           胸径级
               龄级
                          DBH class     A x   a x    l x   lnl x  d x  q x    L x   T x   e x   K x     S x
              Age class
                           (cm)
                Ⅰ          DBH<2        132   132   1 000  6.91  841   0.84  580   1424  1.42   1.84   0.16
                Ⅱ         2≤DBH<7        6    21    159   5.07   15    0.10  152   845   5.31   0.10   0.90
                Ⅲ        7≤DBH<12       10    19    144   4.97   15    0.11  136   693   4.82   0.11   0.89
                Ⅳ        12≤DBH<17      20    17    129   4.86   15    0.12  121   557   4.32   0.13   0.88
                Ⅴ        17≤DBH<22      14    15    114   4.73   15    0.13  106   436   3.83   0.14   0.87
                Ⅵ        22≤DBH<27      16    13     98   4.59   15    0.15   91   330   3.35   0.17   0.85
                Ⅶ        27≤DBH<32       8    11     83   4.42   15    0.18   76   239   2.86   0.20   0.82
                Ⅷ        32≤DBH<37      15     9     68   4.22   8     0.11   64   163   2.39   0.12   0.89
                Ⅸ        37≤DBH<42       8     8     61   4.10   23    0.38   49    98   1.63   0.47   0.63
                Ⅹ        42≤DBH<47       5     5     38   3.63   8     0.20   34    49   1.30   0.22   0.80
                Ⅺ         DBH≥47         4     4     30   3.41   —     —      15    15   0.50   —       —
              注: A x . x 龄级现有个体数ꎻ a x . A x 匀滑后 x 龄级的存活个体数ꎻ l x . 标准化存活个体数ꎻ lnl x . 标准化存活数对数ꎻ d x . x 到 x+1 龄
            级间隔期内标准化死亡数ꎻ q x . 死亡率ꎻ L x . x 到 x+1 龄级间隔期的存活个体数ꎻ T x . 第 x 龄级到超过第 x 龄级的个体总数ꎻ e x . 生命
            期望值ꎻ K x . 消失率ꎻ S x . 存活率ꎮ
              Note: A x . Individual number of age class xꎻ a x . Number of surviving individuals of age class x after A x smooth slidingꎻ l x . Standardized
            number of surviving individualsꎻ lnl x . Logarithm of standardized survival numberꎻ d x . Standardized number of deaths during the interval
            between age class x to x+1ꎻ q x . Mortalityꎻ L x . Number of surviving individuals between age class x to x+1ꎻ T x . Total number of individuals
            age class x to over xꎻ e x . Life expectancyꎻ K x . Vanish rateꎻ S x . Survival rate.

            e 在第Ⅱ龄级急剧升高至最大值(5.31)ꎬ后随龄级                         合效果最优ꎬ美丽火桐种群存活曲线符合 Deevey ̄
             x
            增加逐渐减小ꎬ至第Ⅺ龄级降至最小值(0.50)ꎮ                           Ⅲ型曲线ꎮ
                 由图 2 可知ꎬ美丽火桐种群标准化存活数对数                        3.3 美丽火桐种群生存分析
            (lnl )随龄级增加而减少ꎬ第Ⅰ至第Ⅱ龄级存活曲                              美丽火桐种群生存率( S )、累计死亡率( F )、
                                                                                                          i
                                                                                         i
                x
            线斜率大ꎬ表明该阶段死亡率增加ꎬ个体存活数减                             死亡密度(f )及危险率( λ ) 的生存函数曲线如图
                                                                         i             i
            少ꎻ第Ⅱ至第Ⅸ龄级存活曲线斜率较小ꎬ即该阶段                             3 和图 4 所示ꎮ 随龄级增加种群 S 单调递减ꎬ至
                                                                                               i
            各龄级死亡率相当ꎻ第Ⅸ至第Ⅺ龄级存活曲线斜                              第Ⅺ龄级达到最小值ꎻF 则单调递增ꎬ至第Ⅺ龄级
                                                                                     i
            率增大ꎬ死亡率增加ꎮ 美丽火桐种群存活曲线拟                             达到最大值ꎬ各龄级种群 S 均远低于 F ꎻ种群 f 在
                                                                                       i          i       i
            合结果如表 4 所示ꎬ指数函数模型和幂函数模型                            第 I 龄级有最大值ꎬ向第Ⅱ龄级过渡时急剧减小ꎬ
            的拟合结果均达到极显著水平( P<0.01)ꎬ但幂方                         后随龄级增加总体呈下降趋势并趋近于 0ꎬ表明幼
            程的 R 值和 F 值均大于指数方程ꎬ表明幂方程拟                          龄个体有较高死亡率ꎬ 但种群在中后期生长中面
                   2