Page 33 - 《广西植物》2026年第2期
P. 33

2 期                  聂瑞敏等: 滇山茶品种的花色性状分类及花瓣理化因子分析                                            2 2 7

                                    表 3  100 个滇山茶花瓣样本的花色表型聚类分析结果
                       Table 3  Clustering analysis results of flower color phenotypes in 100 camellia petal samples
                                                                           ∗
                                                                         ∗
                                                                   CIEL a b 颜色空间
                                                                       ∗
                                                                       ∗
                                                                 CIEL a b  ∗  color coordinate
                                                                     ∗
                   色系            数量
                 Color series    Number
                                              明度           红度            黄度            彩度          色相角
                                                   ∗            ∗             ∗            ∗
                                          Lightness (L )  Redness (a )  Yellowness (b )  Chroma (C )  Hue angle (h)
                  红紫色             59       35.92 ~ 51.83  38.22 ~ 46.56  1.90 ~ 14.72  38.38 ~ 47.83  2.54 ~ 19.30
                 Red ̄purple
                   红色              1          29.94        31.96         10.34        33.59         17.92
                    Red
                  粉紫色             30       50.33 ~ 68.42  35.78 ~ 52.77  -7.95 ~ 4.64  36.15 ~ 52.77  -10.09 ~ 5.75
                 Pink ̄purple
                   白色              6       82.88 ~ 90.34  1.58 ~ 3.79  0.82 ~ 6.28   2.64 ~ 7.13  18.05 ~ 67.81
                   White
                  浅粉色              4                     14.40 ~ 25.09  -4.71 ~ 1.08  14.44 ~ 25.53  -11.08 ~ 4.21
                  Light ̄pink


                 ∗  ∗                ∗  ∗                 ∗  ∗   ∗
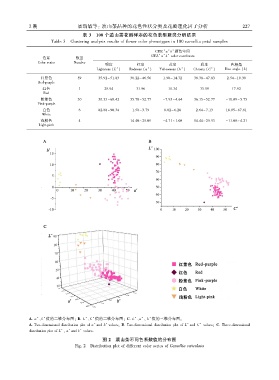
             A. a 、b 值的二维分布图ꎻ B. L 、C 值的二维分布图ꎻ C. L 、a 、 b 值的三维分布图ꎮ
                                                                                 ∗
             A. Two ̄dimensional distribution plot of a and b valuesꎻ B. Two ̄dimensional distribution plot of L and C  ∗  valuesꎻ C. Three ̄dimensional
                                              ∗
                                         ∗
                           ∗  ∗    ∗
             distribution plot of L ꎬ a and b values.
                                             图 2  滇山茶不同色系数值的分布图
                                 Fig. 2  Distribution plot of different color series of Camellia reticulata
   28   29   30   31   32   33   34   35   36   37   38