
Page 88 - 《广西植物》2025年第10期
P. 88
1 8 1 8 广 西 植 物 45 卷
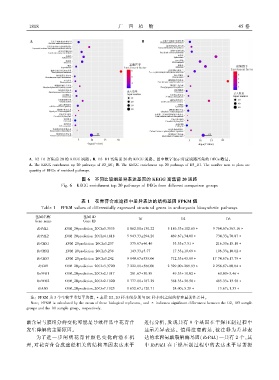
A. D2_D1 富集前 20 的 KEGG 通路ꎻ B. D3_D1 富集前 20 的 KEGG 通路ꎮ 图中数字表示对应通路富集的 DEGs 数量ꎮ
A. The KEGG enrichment top 20 pathways of D2_D1ꎻ B. The KEGG enrichment top 20 pathways of D3_D1. The number next to plots are
quantity of DEGs of enriched pathways.
图 6 不同比较组差异表达基因的 KEGG 富集前 20 通路
Fig. 6 KEGG enrichment top 20 pathways of DEGs from different comparison groups
表 1 花青苷合成途径中差异表达的结构基因 FPKM 值
Table 1 FPKM values of differentially expressed structural genes in anthocyanin biosynthetic pathways
基因名称 基因 ID
D1 D2 D3
Gene name Gene ID
RrPAL1 EVM_20prediction_20Chr3.3535 1 862.00±130.22 5 186.33±102.65∗ 9 764.67±363.16∗
RrPAL2 EVM_20prediction_20Chr4.1818 5 943.33±294.26 469.67±34.00∗ 734.33±70.87∗
RrCHS1 EVM_20prediction_20Chr3.237 375.67±46.46 53.33±7.51∗ 216.33±15.18∗
RrCHS2 EVM_20prediction_20Chr3.238 143.33±5.77 17.33±10.69∗ 106.33±10.02∗
RrCHS3 EVM_20prediction_20Chr3.242 9 840.67±535.06 712.33±43.89∗ 17 74.67±17.79∗
RrCHI EVM_20prediction_20Chr3.3720 7 222.00±386.00 2 329.00±289.93∗ 2 258.67±80.04∗
RrDFR1 EVM_20prediction_20Chr2.1017 281.67±30.89 49.33±10.02∗ 60.00±3.46∗
RrDFR2 EVM_20prediction_20Chr2.1020 1 777.00±187.29 388.33±30.50∗ 483.33±13.58∗
RrANS EVM_20prediction_20Chr7.1925 1 652.67±120.71 24.00±5.29∗ 13.67±1.53∗
注: FPKM 为 3 个生物学重复平均值ꎬ∗表示 D2、D3 样本组分别与 D1 样本组之间的存在显著性差异ꎮ
Note: FPKM is calculated by the mean of three biological replicatesꎬ and ∗ indicates significant differences between the D2ꎬ D3 sample
groups and the D1 sample groupꎬ respectively.
酸含量与膜组分的变化可能是导致样品中花青苷 进行分析ꎬ发现共有 9 个基因在干燥压制过程中
发生降解的主要原因ꎮ 显示差异表达ꎮ 值得注意的是ꎬ被注释为差异表
为了进一步阐明花青苷 颜 色 变 化 的 潜 在 机 达的苯丙氨酸裂解酶基因(RrPAL) 一共有 2 个ꎬ其
理ꎬ对花青苷合成途径相关的结构基因表达水平 中 RrPAL1 在干燥压制过程中的表达水平显著提