Page 10 - 《广西植物》2022年第12期
P. 10

2 0 0 0                                广  西  植  物                                         42 卷


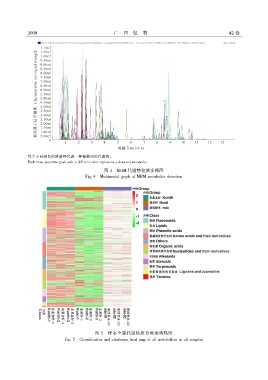
             每个不同颜色的质谱峰代表一种检测到的代谢物ꎮ
             Each mass spectrum peak with a different color represents a detected metabolite.
                                               图 4  MRM 代谢物检测多峰图
                                       Fig. 4  Multimodal graph of MRM metabolite detection


                                           图 5  样本全部代谢物质分类聚类热图
                              Fig. 5  Classification and clustering heat map of all metabolites in all samples
   5   6   7   8   9   10   11   12   13   14   15